
Market QuickTake
Six Questions Behind the Market’s Recent Volatility and Rotation
1) What has caused the recent market volatility?
Equity markets traded lower this week, with the Nasdaq and S&P 500 under pressure. While headline returns were negative, the sell-off didn't reflect a broad market breakdown. Beneath the surface, there was a significant market rotation as leadership shifted away from mega-cap technology toward more cyclical and value-oriented areas, including Value, Financials, Industrials, and Materials. The catalyst for the rotation was concern that advances in AI (specifically Anthropic’s new legal and financial research tools) could disrupt large portions of the traditional software industry. The concerns didn't trigger indiscriminate selling, but they did cause investors to rotate away from crowded growth leadership toward other areas of the market.
2) What did market breadth and factor performance signal beneath the surface?
Despite headline index declines, market breadth improved. The Equal Weight S&P 500, the Value factor, and the Dow Jones Industrial Average all posted gains, and despite small-caps trading lower they outperformed large caps. Breadth indicators showed broader participation, with an increasing number of S&P 500 and Russell 2000 stocks trading above their 50-day moving averages. While breadth improved, the improvement was uneven. Nasdaq breadth continued to weaken, reflecting ongoing pressure in growth- heavy segments of the market. Overall, the data signals a violent rotation trade rather than systemic market weakness (i.e., investors are reallocating risk rather than exiting the market completely).
3) How did macro and cross-asset markets respond?
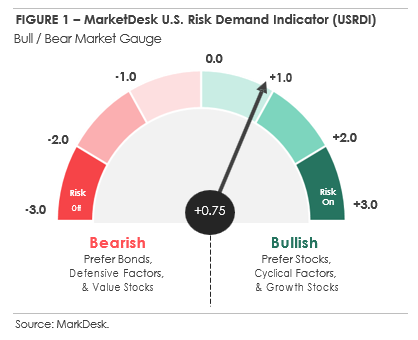
In fixed income, the Treasury yield curve steepened as longer-maturity yields rose. The rise reflected a repricing toward a higher-for-longer policy outlook following Kevin Warsh’s nomination as Federal Reserve Chair. His hawkish stance and emphasis on balance sheet reduction weighed on bonds, pushing Treasury yields higher. Corporate bonds traded lower as credit spreads widened, with investment-grade bonds underperforming and high-yield spreads widening more sharply than IG. Risk-sensitive assets also saw pressure. Bitcoin fell nearly -20% after breaking key technical levels, triggering a liquidation cascade, while gold declined due to a technical breakdown and policy repricing tied to Warsh’s nomination. While neither asset is included in one of the major data models we follow - U.S. Risk Demand Indicator (USRDI), both reinforced the broader deleveraging tone (see Figure 1).
FIGURE 1 – U.S. Risk Demand Indicator (USRDI)
4) Why hasn’t USRDI turned risk-off?
The U.S. Risk Demand Indicator (USRDI) declined this week, falling from +1.02 to +0.75, but it remains firmly in positive territory. That’s an important distinction. USRDI is designed to measure broad-based market stress, not isolated weakness or sharp moves in specific corners of the market. This week’s volatility has been driven primarily by rotation and deleveraging, not a systemic deterioration in risk appetite. While headline indices declined, underlying breadth improved and leadership shifted toward value- oriented and cyclical areas of the market.
Importantly, USRDI doesn't incorporate commodity or crypto price action. As a result, steep losses in Bitcoin and gold/silver (while notable) don't directly impact the signal. Instead, USRDI focuses on more traditional and historically reliable stress indicators, including high-yield credit spreads, equity volatility, and factor behavior. While these inputs weakened modestly, none have reached levels consistent with a sustained risk-off regime.
5) Why does USRDI remain positive?
Despite the recent volatility, the inputs suggest the risk pullback remains contained. High-yield credit spreads have not materially repriced wider, and despite the VIX rising above 20, volatility remains well below levels typically associated with disorderly market conditions. Market breadth also improved, and equal-weight and value-oriented indices outperformed, reinforcing the view that capital is being reallocated, not withdrawn.
Together, these dynamics explain why USRDI softened but didn't flip negative. The signal is acknowledging rising uncertainty without confirming a full risk-off environment.
6) What would cause USRDI to turn risk-off, and what are we watching next?
For USRDI to move into risk-off territory, we would need to see broader confirmation across multiple stress indicators. That would include a sustained widening in high-yield credit spreads, a sharper and more persistent rise in volatility, and the continued underperformance of the high beta factor relative to more defensive factors.
The broader market trend remains intact at this time. We are closely monitoring the VIX, high-yield spreads, and factor leadership for signs that risk sentiment is either stabilizing or deteriorating further. Whether this episode remains a contained deleveraging event or evolves into a more persistent risk-off regime will depend on how these datapoints behave in the weeks ahead.
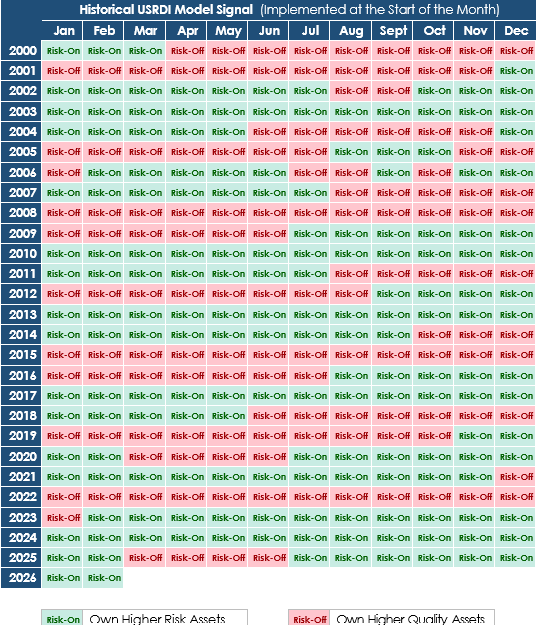
See below for the historical USRDI model signal.
Important Notices & Disclaimer
The indicators discussed in this report are intended to be an indicative metric only and may not be used for reference purposes or as a measure of performance for any instrument or contract or otherwise relied upon by third parties for any other purpose, without the prior written consent of MDR. The indicators discussed in this report were not created to act as a benchmark.
This research is based on current public information that we consider reliable, but we do not represent it is accurate or complete, and it should not be relied on as such. The information, opinions, estimates, and forecasts contained herein are as of the date hereof and are subject to change without prior notification, and there is no guarantee that any future event discussed herein will come to pass.
The information and opinions provided herein are provided as general market commentary only.
The information in this report is not intended to be used as the primary basis of investment decisions, and because of individual client objectives, should not be construed as advice designed to meet the particular investment needs of any investor. The comments may not be relied upon as recommendations, investment advice or an indication of trading intent.
Past performance does not guarantee or indicate future results. Index performance is for illustrative purposes only and does not reflect any management fees, transaction costs or expenses. Indexes are unmanaged and one cannot invest directly in an index. Index performance does not represent the actual performance that would be achieved by investing in a fund.
No mention of a particular security, index, or other instrument in this report constitutes a recommendation to buy, sell, or hold that or any other security, nor does it constitute an opinion on the suitability of any security or index. The report is strictly an informational publication and has been prepared without regard to the particular investments and circumstances of the recipient. READERS SHOULD VERIFY ALL CLAIMS AND COMPLETE THEIR OWN RESEARCH BEFORE INVESTING IN ANY INVESTMENTS MENTIONED IN THE PUBLICATION. INVESTING INVOLVES RISK, INCLUDING THE POSSIBLE LOSS OF PRINCIPAL AND FLUCTUATION OF VALUE.